PEAR
PROJECT.


GRAPHS
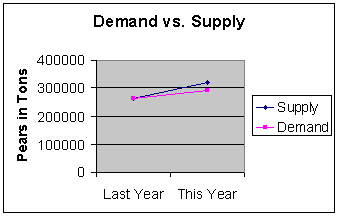
GRAPH ON THE DEMAND AND SUPPLY OF PEARS FOR LAST YEAR AND THIS YEAR.
GRAPH 1
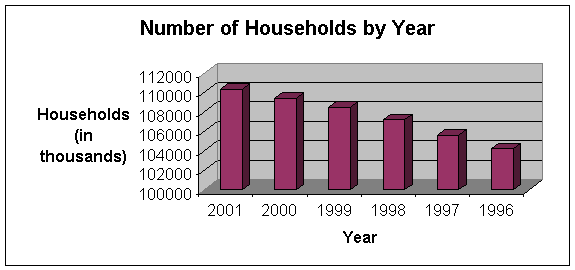
On the most part, this graph portrays a steady and consistent increase regarding the number of households in the U.S. each year. In 1996 there were approximately 104,212,000 households in this country and in 2001 there were about 110,339,000. If trends continue, these numbers should continue to grow.
GRAPH 2
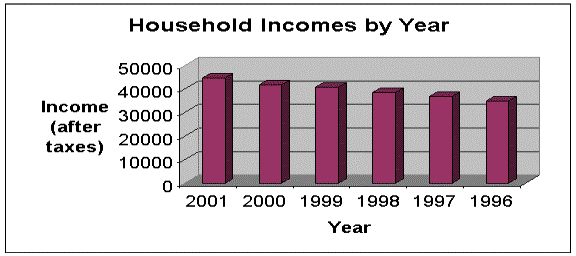
Similarly to the household graph trends, the numbers for household income also consistently increased. Although from 1999 to 2000 there was the slowest increase with an income of 40,625 that only increased to $41,532 the next year. After 2000, the incomes began to increase for in that year it was $44,587.
GRAPH 3
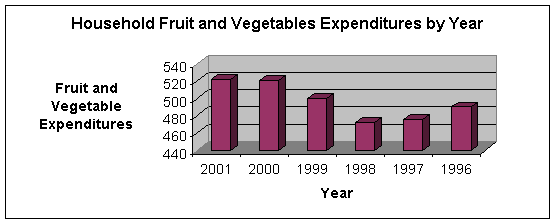
This graph that represents the fruits and vegetables expenditures for each household yearly, has some steady increase; but it isn’t always consistent. In the year 1996, there were 490 expenditures while in 1997 there were 476. As we can see, this is a decrease. The numbers decrease again the next year with 472, but skyrocketed with 500 in 1999. In the year 2000 there were 520 and in the next year there were 521. As we can see, the values for expenditures in this facet can vary.
SUMMARY AND GRAPH FOR LATEST CONSUMER EXPENDITURE SURVEY
Age of
Reference Person:
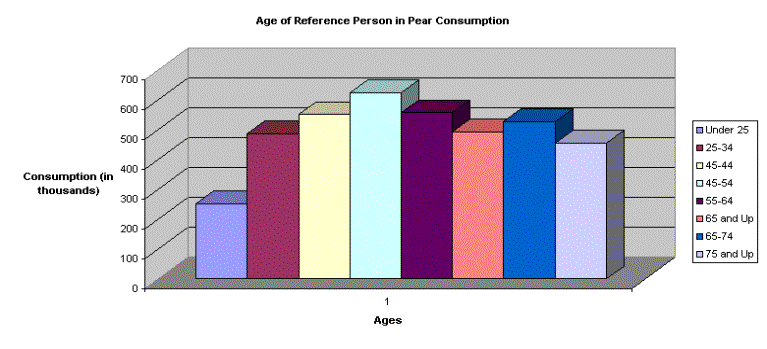
Under the age
of 25, pear consumption is far lower than it is at the rest of the ages. This could be because those under 25 do not
care as much about eating fruits and vegetables because they are in the
carefree days of their youth and not concerned with the health benefits of
eating healthily. As growing up the
person usually starts feeling older after 25 and starts to think that they
should probably take action to prolong their lives be improving their
health. This could explain the gradual
increase of pear consumption to the age group 45-54 where the pear consumptions
are the highest. Often times after this
point people realize they are closer to death and might not care so much about
health instead think that they only live once so they are going to enjoy life.
Income
before taxes:
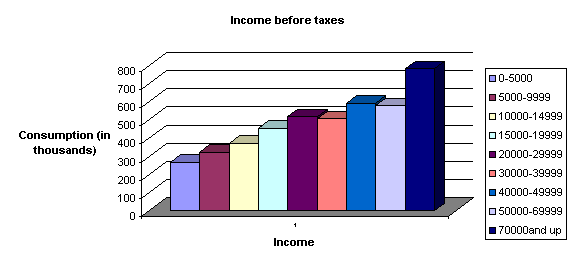
It seems to be
with this graph that there is a positive correlation between income and
consumption. As income increases at each step, consumption increases as
well. This is probably because of the
obvious reason that people can now afford more food. Also one may not have seen having pears in his or her diet as
necessary when buying food, but when income is higher one can decide to spend
money on pears even if it doesn’t look so necessary. Pears are not usually the
cheapest fruit, so one might have substituted at a lower income, but have
variety at a higher income.
Education:
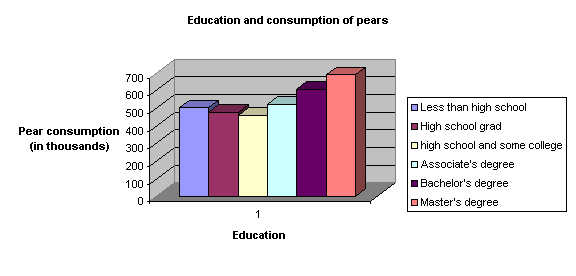
Education
seems to be quite irrelevant to the consumption of pears. However, because the graph does slightly
increase at the three highest education levels, it could be that as people
become more educated, they will know the health benefits of eating pears. Still, at a high school level, most people
have learned about health for many years even at pre-school ages, so it seems
that education is not a determinant of pear consumption.
Average Price of Pears
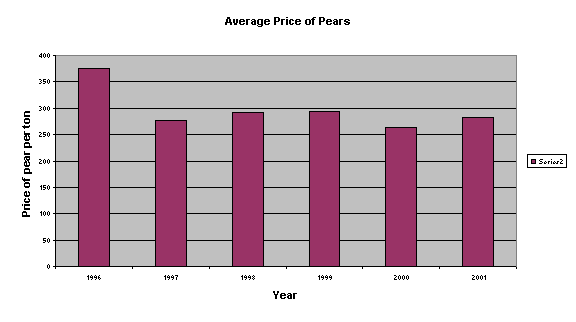
In short, the variation of the average price of pears was all over the place. In 1996 there was an all time high of about 375 per ton but that number substantially diminished to nearly 275 the next year. In 1998, the price was just below 300 and that number increased at a miniscule rate the next year. In 2000, the price was over 250 and in 2001 that number was around 280. As we can see the average price varied without an entirely specific pattern.
U.S. utilization of pears per capita
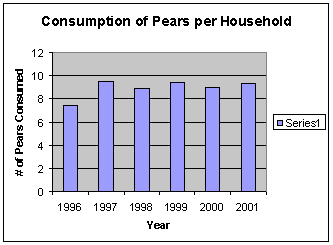
The pattern for the United State’s utilization of pears per capita had an increase decrease relationship throughout. In other words in one year, the number consumed would increase than it was the previous year and the following year it would decrease and the next it would go up and so forth. In 1996, the number of pears consumed was just over six and in the next year, it was under six. Then in 1998, the consumption of pears was around seven pounds, but that number went down in 1999 and this trend of increase then decrease continued until 2001.
MAIN
QUESTIONS FOR THE PROJECT
QUESTION 1
Question 2:
Midpoint Elasticity Equation:
Last year’s
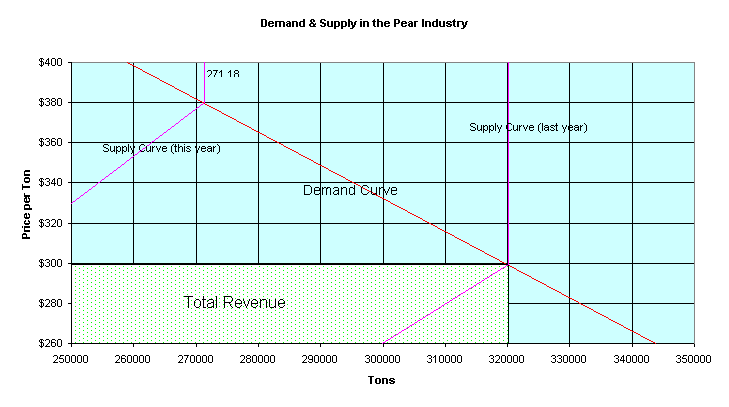
demand: 271,186.4
This year’s
demand: 320,000
Last year’s
price: $380.00
This year’s
price: $300.00
(320,000-271186.4)
/ ((320,000+271186.4)/2) (380-300)/((380+300)/2)
=48813.6/295,593.2 =80/340
=.1651377 =.23529
=.1651377/.23529
=.7018
.7018-
Inelastic
Total Revenue
Equation:
Last Year:
271186.4*380.0 = $103,050,832
This Year:
320000*300.0= $96,000,000
Total Revenue
is less when price decreases, therefore inelastic.
Question 3:
It is important to assume that
demand for pears has not changed while calculating the elasticity because we
are considering the change in quantity demanded in response to the change in
price instead of the change in demand with respect to other factors like change
in tastes, etc. This is applying the rule of ceteris paribus, the other
things-equal assumption which assumes all variables are held constant except
those being looked at in the analysis. The variable we are looking at is
price.
Question 4:
From our calculations, we saw that the demand for pears was inelastic (0.7018) which agreed with the fact that the demand between the two years did not really change as price went down. Total revenue also decreased from $103,050,832 to $96,000,000 that also agreed with the conclusion that when demand is inelastic, total revenue decreases as price decreases.
Question 5:
Percentage
Change in Production associated with dumping the pears
(320,000-290,000)/((320,000+290,000)/2)
=30,000/305,000
=. 09836
.7018 =
.09836/X
.7018X= .09836
=.14015
=14.015
%
New Price =
300*1.14015
=
$342.05
Estimated
Marginal cost of dumping the pears:
30,000*300= $
9,000,000
By dumping the
pears the pear growers hope that the price will increase enough for the
remaining pears so that the marginal benefits or extra dollars they will make
will cover the marginal cost of dumping.
Estimated
Marginal benefit of dumping the pears:
290,000*42.05=
$12,194,500
Benefits the
pear growers: 12,194,500-9,000,000= $3,194,500
Question 6:
Estimating the elasticity is important because it determines how much marginal benefit and cost the growers will incur from their actions. For instance since the demand is inelastic, a decrease in quantity and price will decrease their total revenue which will reduce their marginal benefits and increase their marginal costs.
Question 7:
As the
growers’ consulting economist, we would advise them to dump and destroy the
pears because the marginal benefits exceed the marginal cost of dumping due to
the nature of the market. The price
would be driven up with allows the benefits on all 290,000 less to be more than
the loss of the 30,000 pears dumped at $300.00 a ton. The price has shifted up to $342.05. They will not fulfill the entire demand of 320,000 because of the
30,000 lost in supply, but it appears that the consumers will respond and buy
at the price of $342.05. The growers
are correct in assuming they will be better off in dumping because if they dump
supply will decrease, which will allow the price to increase.
Question 8:
To reduce the dumping of pears, the government should enforce more laws to encourage pear exports. Increasing the exports on pears will increase production; increase revenue for both the producers and the government, which in turn benefits the society because an increase in Government revenue will increase social development.
QUESTION
9:
Even
though producers feel they would be better off dumping some of their
production, nothing has in fact gone wrong. Other than the surplus of pears
that are being dumped, I don’t think that there is any serious defect in the
market system. There were just too many pears and not enough people to eat
them. Therefore it is in the best interest for the producers to throw away a
portion of their pears because that will result in their highest profit.
One way the
market could correct this problem of excess pears is through the natural course
of “invisible hand”. If there are too many pears then the price will be driven
down and if there is not enough pears then the price will rise. This cycle has
a way of evening itself out. Therefore the growers will promote the interests
of the public and the invisible hand theory will remain intact. Adam Smith need
not be concerned about this because it is his words that tell us that producers
produce the bundle most wanted. There is not enough evidence that government
needs to interfere.
SUMMARY AND GRAPH FOR LATEST CONSUMER EXPENDITURE SURVEY
Age of
Reference Person:
Under the age
of 25, pear consumption is far lower than it is at the rest of the ages. This could be because those under 25 do not
care as much about eating fruits and vegetables because they are in the
carefree days of their youth and not concerned with the health benefits of
eating healthily. As growing up the
person usually starts feeling older after 25 and starts to think that they
should probably take action to prolong their lives are improving their
health. This could explain the gradual
increase of pear consumption to the age group 45-54 where the pear consumptions
are the highest. Often times after this
point people realize they are closer to death and might not care so much about
health instead think that they only live once so they are going to enjoy life.
Income
before taxes:
It seems to be
with this graph that there is a positive correlation between income and
consumption. As income increases at each step, consumption increases as
well. This is probably because of the
obvious reason that people can now afford more food. Also one may not have seen having pears in his or her diet as
necessary when buying food, but when income is higher one can decide to spend
money on pears even if it doesn’t look so necessary. Pears are not usually the
cheapest fruit, so one might have substituted at a lower income, but have
variety at a higher income.
Education:
Education
seems to be quite irrelevant to the consumption of pears. However, because the graph does slightly
increase at the three highest education levels, it could be that as people
become more educated, they will know the health benefits of eating pears. Still, at a high school level, most people
have learned about health for many years even at pre-school ages, so it seems
that education is not a determinant of pear consumption.
EXTRA
CREDIT QUESTIONS.
QUESTION 1:
|
271186 |
380 |
|
|
|
|
|
|
320000 |
300 |
|
-0.0016389 |
|
|
|
|
|
|
|
-524.4397 |
824.4397 |
|
|
|
|
|
|
|
|
|
|
|
|
|
|
-444.4397 |
824.4397 |
|
|
|
|
|
|
|
|
|
|
|
|
|
|
|
|
y=-.0016389x+824.4397 |
|
|
|
|
|
|
|
|
|
|
|
|
|
|
|
503052.4939 |
|
|
|
|
|
|
|
251526.247 |
412.2199 |
|
|
|
|
|
|
|
|
|
|
|
|
|
|
|
|
|
|
|
|
|
|
68473.75303 |
|
|
|
|
|
|
|
||
QUESTION 3
Extra Credit
Option 3
http://www.usapears.com/home.php?PHPSESSID=df456c6850540df703e08e8d2dc4fe35
This website is the Pear Bureau
Northwest which is a division of USA Pears. This association raises awareness
of pears and the pear growing industry as well as provides helpful information
regarding pear cooking. The website is updated fairly regularly and contains a
search engine for anything related to pears.
This
website represents California Barlett Pears, a large pear-growing company. This
impressive website provides relevant information for pear growers, retailers,
or consumers about this particular industry. This website has a special
advisory board, links, and a recipe cookbook.
http://www.house.gov/walden/press/1999/feb/pr020599.html
This small webpage explains
Congressman Greg Walden’s legislation to amend the Export Apple and Pear Act,
which restrict pear farmers’ ability to export. This site gives further
information on how the pear industry could be influenced and changed by this
potential bill.
http://www.calpear.com/brd/nws010130.cfm
Calpear.com provides information
about the California pear-growing industry with the Pear-Street Journal.
This publication provides the most up-to-date coverage about the pear market
and its implications.
http://www.farmworld.com/a/fw1665.html
Farmworld.com gives information
regarding virtually any crop conceivable; in this case the webpage is pears.
This page contains a forum, links to pears, and information about this crop
that’s sweeping the nation.
For a change of pace, the South
African Cactus Pear Association provides helpful information about pears and
gives insight for American pear growers. A number of these pears are exported
to the U.S. so it affects our market to a degree. It’s also interesting and
relates to the topic of pears.